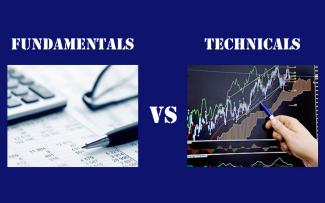
Fundamental and Technical Analysis
Written by Rick Welch
Which is better, a stock picking strategy based on fundamental analysis or one based on technical analysis? Depends on who you ask. Fundamental analysis involves the big picture, while technical analysis looks at just a few critical data points, typically share price and trade volume. Fundamental analysis focuses on the why. Why do we think the price of a stock will go up or down in the future? As defined, fundamental analysis is the calculation of the intrinsic or fundamental value of a stock with the objective of realizing a profit from the difference between the calculated price and the actual market price of the stock. Fundamental analysis can be divided into three components. Macroeconomic analysis focuses on how the broader economy (both domestic and international) impacts the industry in which the firm operates. Impacts are best assessed with a clear understanding of the current business cycle and monetary policy. Industry specific analysis is concerned with the typical life cycle of the industry and the long-term strategic issues it faces. The last component, firm-specific analysis, includes an examination of the company and its earnings and dividend prospects, financial condition, management team and products. Fundamental analysts use publicly available information, beyond the trading history of a security, to estimate future investment performance.
Technical analysis focuses on the what. In particular, what type of recurring and predictable patterns of price movement can be identified and exploited for investment gain. The basic premise here is that stock prices move in patterns and price movement or action tends to repeat itself. Although technical analysts recognize the value of information regarding the future economic prospects of a firm, they believe that such information is already “priced in” to the market price or is otherwise not necessary for a successful trading strategy. Technical analysis requires a timely interpretation of price movement above or below moving averages (examples include 10, 20, 50 and 200 day). These moving averages smooth out day-to-day price movements and with study may reveal momentum or up or down-trending stock price movement. The range of expected price movement for a stock is a set of boundaries known as resistance levels (upper boundary) and support levels (lower boundary) which are price levels above which it is difficult for stock prices to rise, or below which it is unlikely for them to fall.
Can fundamental and technical analysis be combined? Yes. Most investors, with long term investing horizons, rely on fundamental analysis in building successful, broadly diversified investment portfolios. Traders, with shorter term horizons (say just days or weeks), will look to technical indicators as they make their stock purchases and sales. While most investors look long term, they still want the best entry (buy-in) and exit (selling) points they can obtain. One of the most popular methods of assessing market sentiment for a particular stock is to look at recent trade volumes. Large spikes in daily trade volumes suggest that the stock is receiving increased investor attention. Daily trade volumes will often increase as an identified pattern or price trend (in either direction) gains momentum. A sudden decrease in volume can suggest that the market is losing interest and that a reversal of the noted pattern or price trend may be imminent.

