Understanding Expected Return
Would you build a house without blueprints? Of course not, because in attempting to do so you could waste lots of time and money and still end up with a finished product that is far below expectations. The same goes for investing. Without a solid plan or blueprint, you may very well end up with a retirement that falls disappointingly short of what you expect or want. The foundation for an investment plan is a strategic asset allocation which specifies the investment allocation for the three traditional asset classes; stocks, bonds and cash. In choosing the appropriate allocation (for example, 50% stocks, 40% bonds and 10% cash) you must balance risk and expected return in a manner that is appropriate for you and your circumstances. History teaches us that choosing the right long term strategic asset allocation is more important than the short-term tactical adjustments you may make along the way. In fact, asset class allocation (94%) has a much larger impact than both asset selection (4%) and market timing (2%) in determining long term portfolio returns.
Investors should view expected return as one of the primary components of building a portfolio that will provide the investment return they will need to retire comfortably. Expected return compensates investors for the market risk they assume when making an investment selection. As defined, expected return “is a return based on the probability-weighted average of the possible returns from an investment.” In this exercise, we will use the following long term expected returns for these asset classes, including US Large Cap (7.4%), US Small Cap (8.7%), International (8.2%), Bonds/Barclays US Aggregate (3.6%) and cash (2.0%). In the case of stocks, reliable expected returns can be calculated using a historical long-term approach or a valuation approach. With the long-term approach we consider the historical difference in returns between stocks and risk-free bonds (3-month US Treasury Bills are the most common reference point) and make an assumption that the future will look like the past. An important disclaimer here might be that while historical returns are a good guide, they are not necessarily predictive of future investment outcomes. In contrast, the valuation approach suggests that the expected return of a stock is equal to the sum of its beginning dividend yield, plus long-term average real growth in earnings per share (EPS), plus implied inflation. The expected return of a bond is equal to the beginning bond yield at the time of purchase. With bonds, we pay less attention to long-term historical data and focus primarily on yield-to-maturity (YTM), which is flexible enough to capture the ups and downs of interest rate movement, while avoiding the shortcomings of assuming that trends suggested by historical data will repeat themselves in the future. There are several ways to approximate the expected return of cash, however, the one we favor is to use the estimated long-term inflation rate which currently stands at 2.0%.
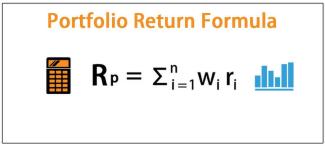
To calculate the expected return of a portfolio, we must compute the weighted average of the expected returns for all of the assets in the portfolio, with each asset’s return weighted by the portion of the portfolio it represents. So, in returning to our earlier example, lets calculate the expected return of a portfolio which allocates 50% to stocks (30% to US Large Cap, 10% to US Small Cap and 10% to International), 40% to Bonds and 10% to Cash. The mathematical expression would look like this:
Expected Return of a Portfolio = .30(7.4%) + .10(8.7%) + .10(8.2%) + .40(3.6%) + .10(2.0%) = 5.55%

